Beach Morphodynamics Monitoring
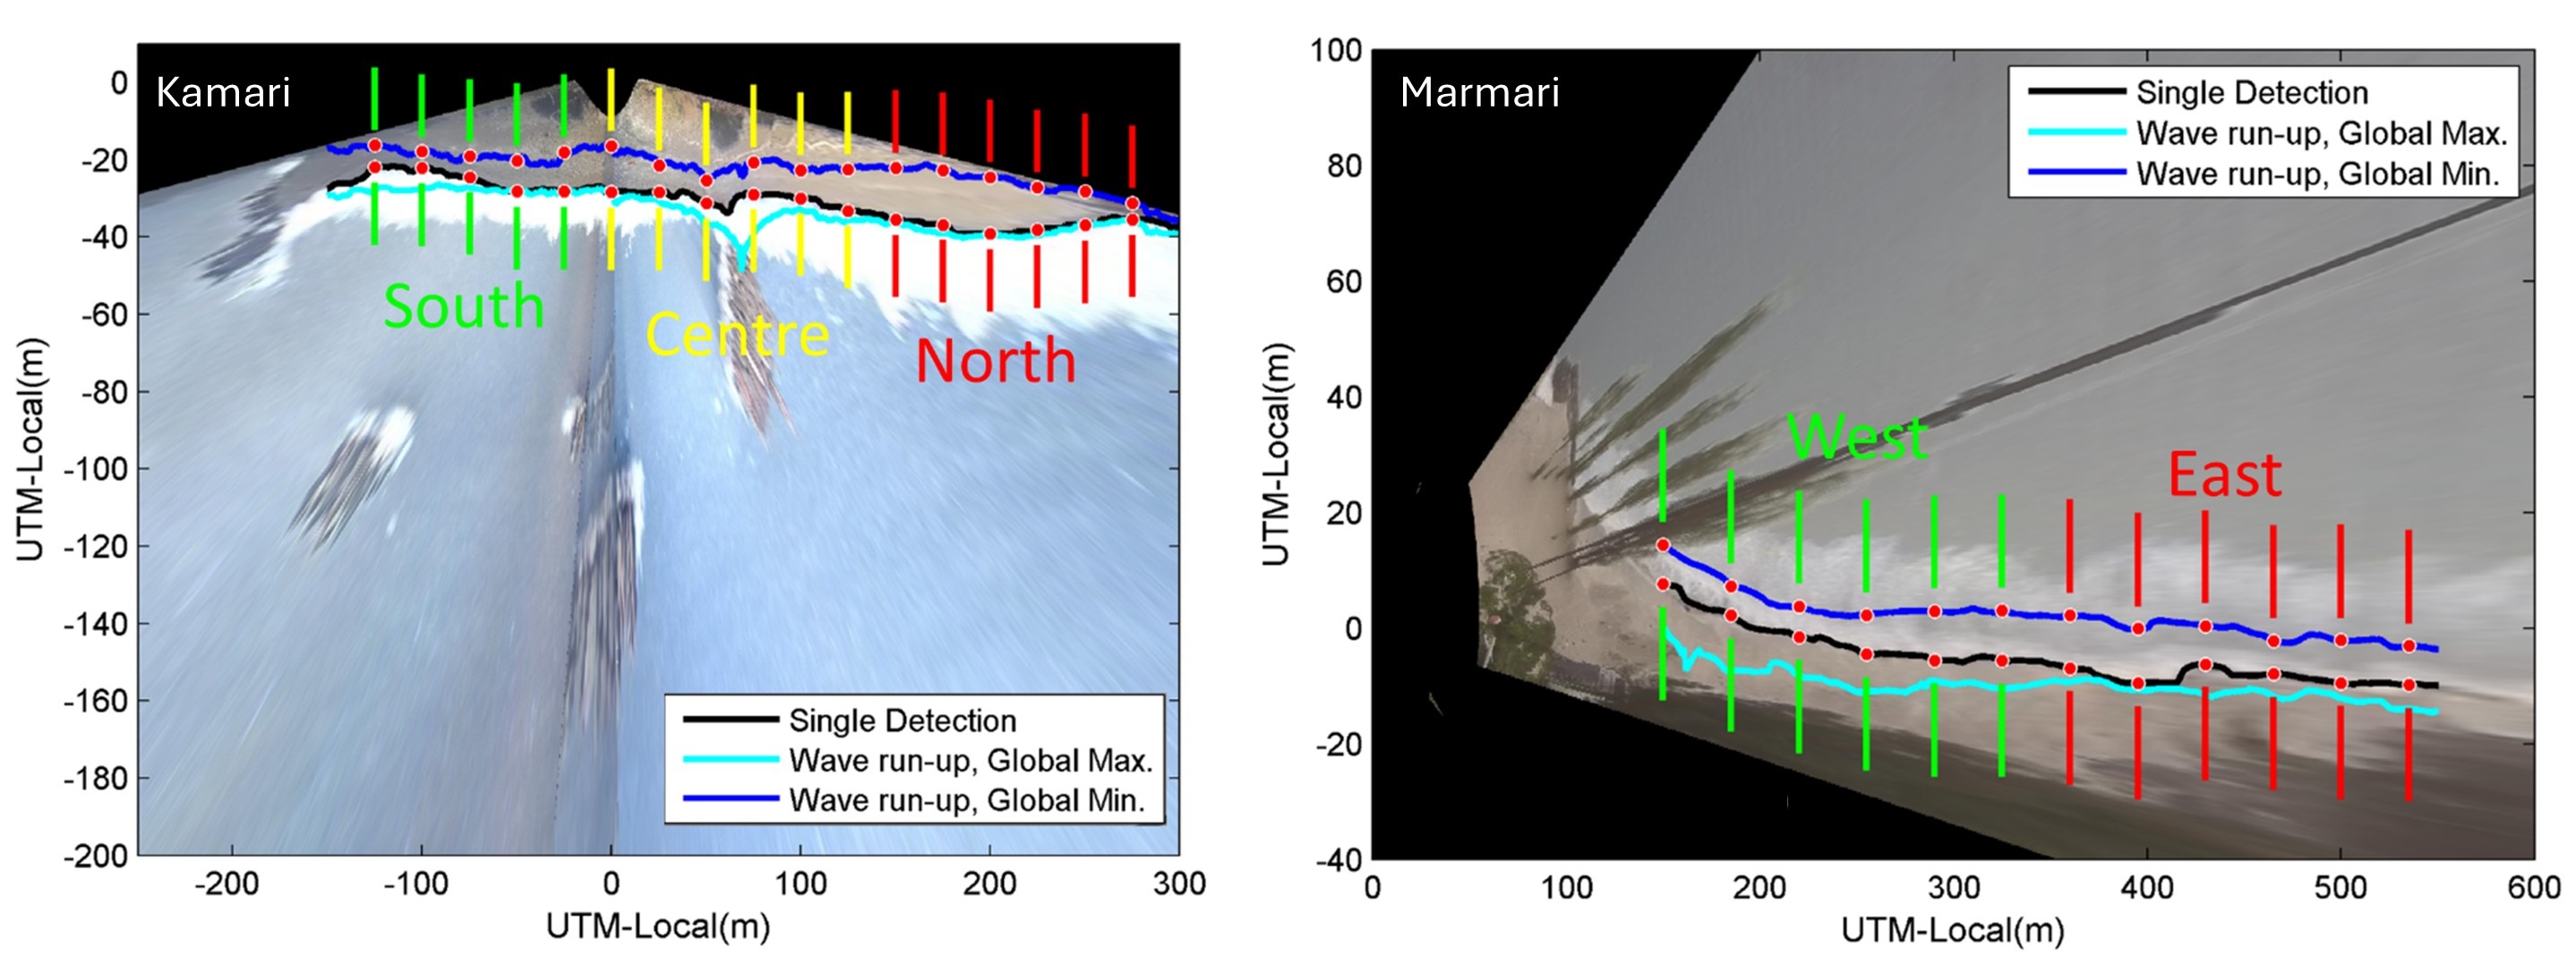
The monitoring period for Kamari beach was between 10/02/2023-16/03/2023, while in Marmari frοm 12/11/2022-06/04/2023. For in-depth investigation of beach morphodynamics, the monitored part of Kamari beach was divided into 3 sectors (eastern, central and western), whereas the monitored part of Marmari beach was divided into 2 sectors (western and eastern). For each sector, 6 equally spaced positions/cross-shore profiles were extracted, with the exception of the southern sector of Kamari beach for which 5 positions were extracted.
 Kamari Beach: Variability of Shoreline Position
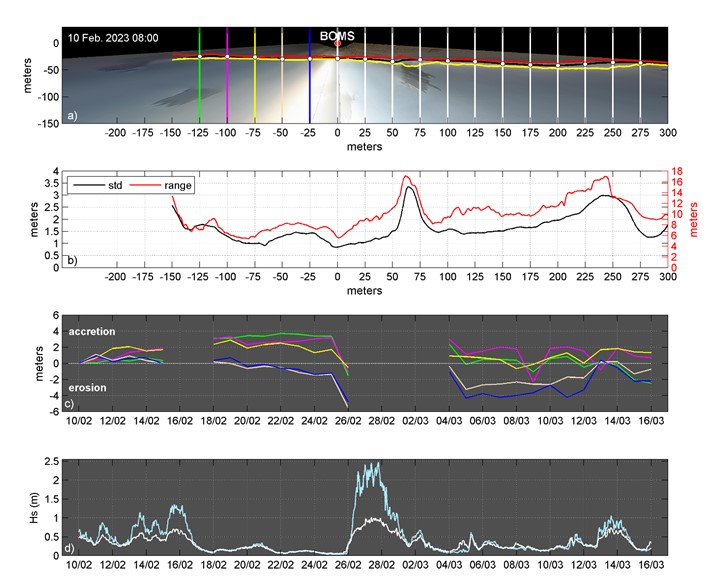
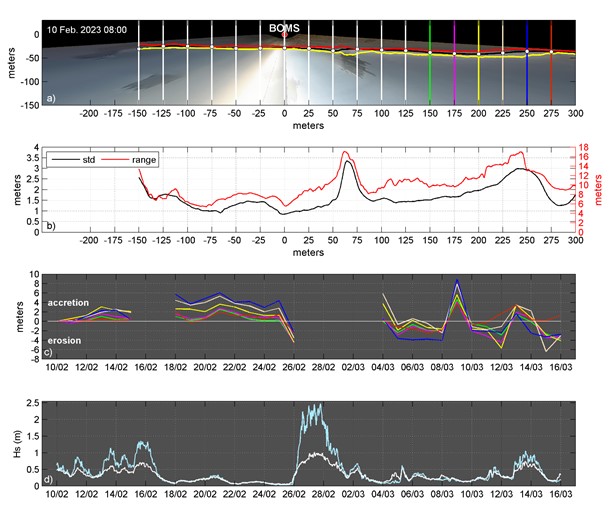
The 5 selected positions of the southern sector of the monitored part of Kamari beach are found to be triggered at times of higher hydrodynamic conditions. More specifically, at times when significant wave heights approaching from offshore are greater than 1 m, the wave heights at the area located at the shadow of the breakwaters is in any case less than 1 m. Nevertheless, and for the whole monitoring period, it was found that shoreline deposition accounted for more than 6 m, with the highest differences found in the area located at the shadow of the breakwaters. These are also the areas where the highest values of standard deviation were recorded.
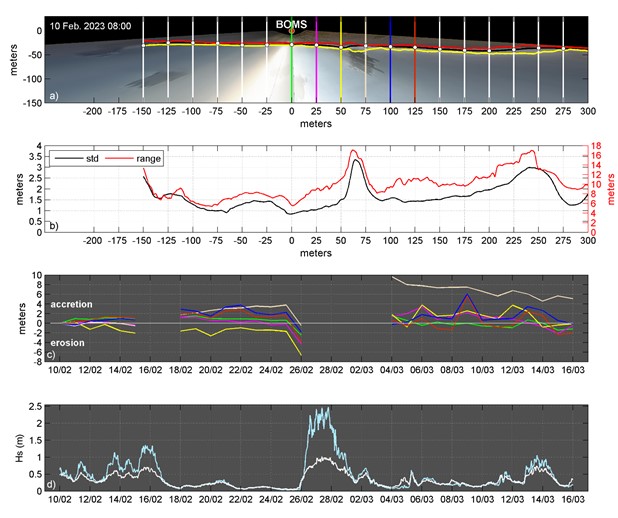
 Shoreline variability at the central sector of the beach, was higher at the locations close to the northern most groyne (at x = 50, 75 and 100 m) with recorded deposition of up to 4 m during the monitoring period. When comparing the changes in this sector between the starting and the ending date of the recording period, no significant changes have been recorded. However, at the position close to the northern groyne (at x = 75), a variability of 10 m was recorded.
 Shoreline position at the locations of the northern sector was found to be eroded by 4 m, compared to the starting date of records. However, there is a case of accretion by 2 m, at the location of x = 275 m, red line).
 Kamari Beach: Variability of Swash Excursion
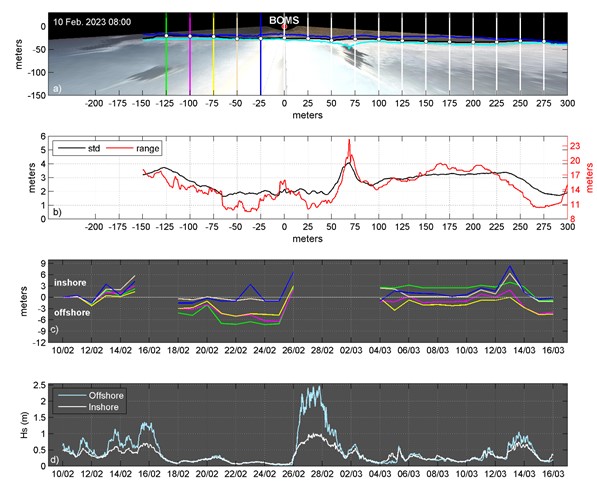
When investigating the temporal evolution of the max. swash excursion (wave run-up) and the shoreline positions in the 5 selected locations along the beach at the southern sector, it is evident in both cases that these locations are triggered at times of high hydrodynamic conditions. Differences in positions of max. swash excursion are found to range between 11 – 14 m, however at the locations at the shadow of the technical works higher deposition is found (e.g. at x between -150 and -100 m, close to the southern groyne and at the shadow of the southern breakwater, as well as at x between -25 and 25 m, at the shadow of the northern breakwater.
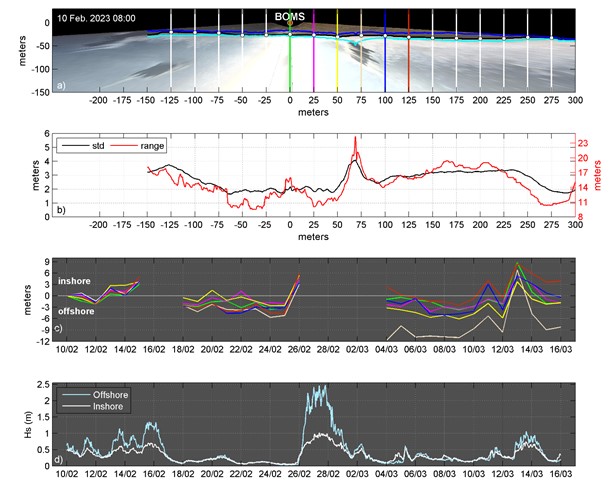
 Regarding the temporal evolution of max. swash excursion alongshore at the central beach sector (at x between 0 and 125 m) it is evident that the positions are triggered at time of high hydrodynamic conditions, with similar trends as in the southern sector.
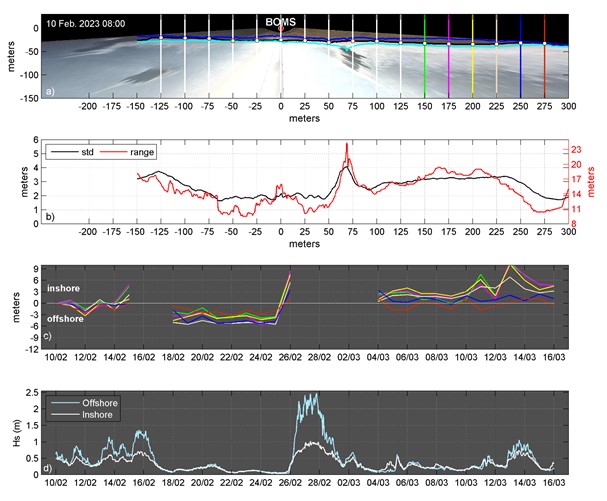
 The highest differences were recorded at the northern beach sector. At the 6 selected locations the range of max. swash excursion was found to be of about 15 m.
 Marmari Beach: Variability of Shoreline Position
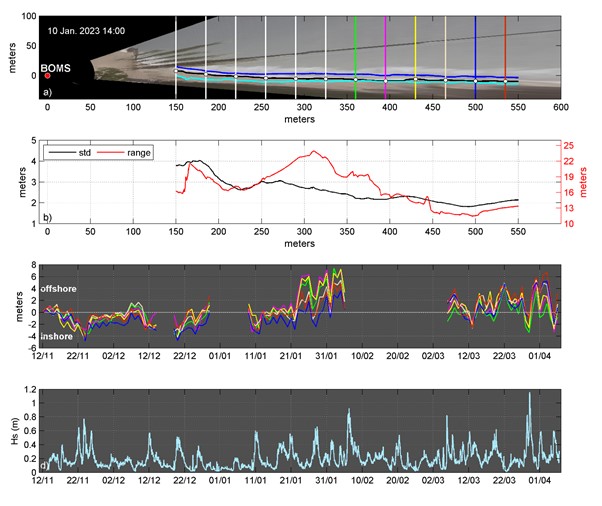
At each of the investigated beach sectors (western and eastern) the recorded differences between minimum and maximum shoreline position was ranging between 11.0 - 23 m και 12.1 – 16.5 , respectively. Lower standard deviations are found to the eastern sector of the beach, which seems to be more “stabilized” compared to the western sector.
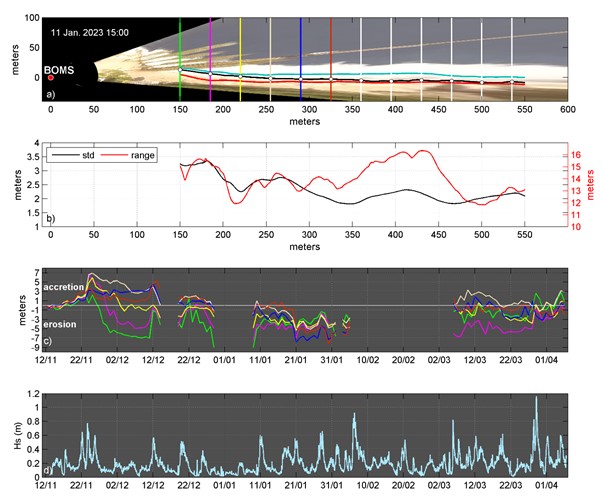 Regarding shoreline position at the western sector, this is found to be controlled by the incoming wave energy. Times of high wave activity are related to significant deposition of the shoreline (e.g. at 22/11, 12/12 and 30/03). Despite the high variability of the 6 selected locations/cross-shore positions at the western sector, related with erosion in most cases, there was no significant difference between the initial and the final date of the recording period.
 Marmari Beach: Variability of Swash Excursion
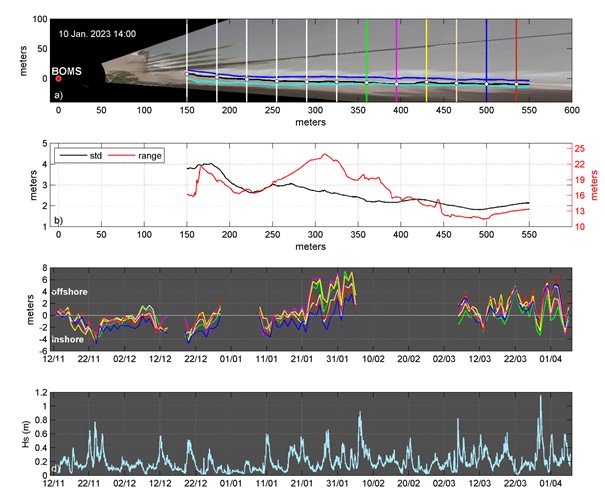
When investigating the evolution of wave run-up positionsat the 6 selected locations of the western sector (compared with the starting recording date) , it is evident that variability was higher at times of high wave activity (e.g. at 22/11, 12/12 and 30/03). Interestignly, wave run-up was found to be highly variable (between 3 – 6 m) at times of low wave activity (e.g. at 02/12 and 22/01, waves of about 0.3 m ). The latter is attributed to the fact that Marmari is categorized as a dissipative beach, of mild nearshore slopes.
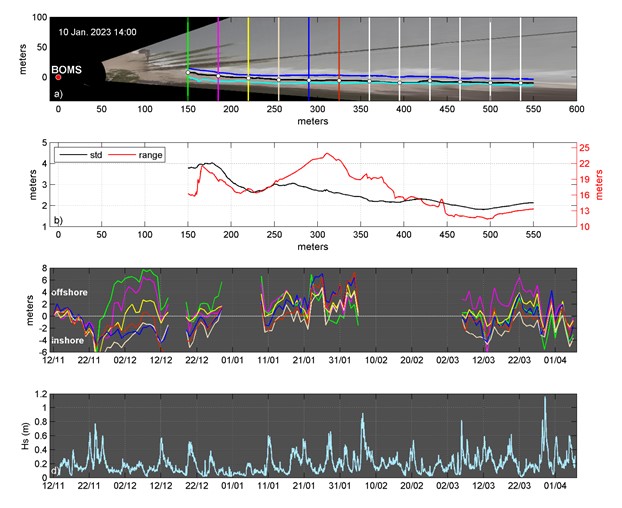 Regarding wave run-up positions at the eastern sector of the beach, this was found to range between 11.8 – 19.2 m. In this sector, wave run-up is found to be triggered and align well with the incoming wave energy. At times of high wave activity (e.g. at 22/11, 12/12 and 30/03) wave run-up variability is higher (of about 2 m) for all of the examined positions.
