
Extreme Sea Levels (ESLs) – Trends and Projections
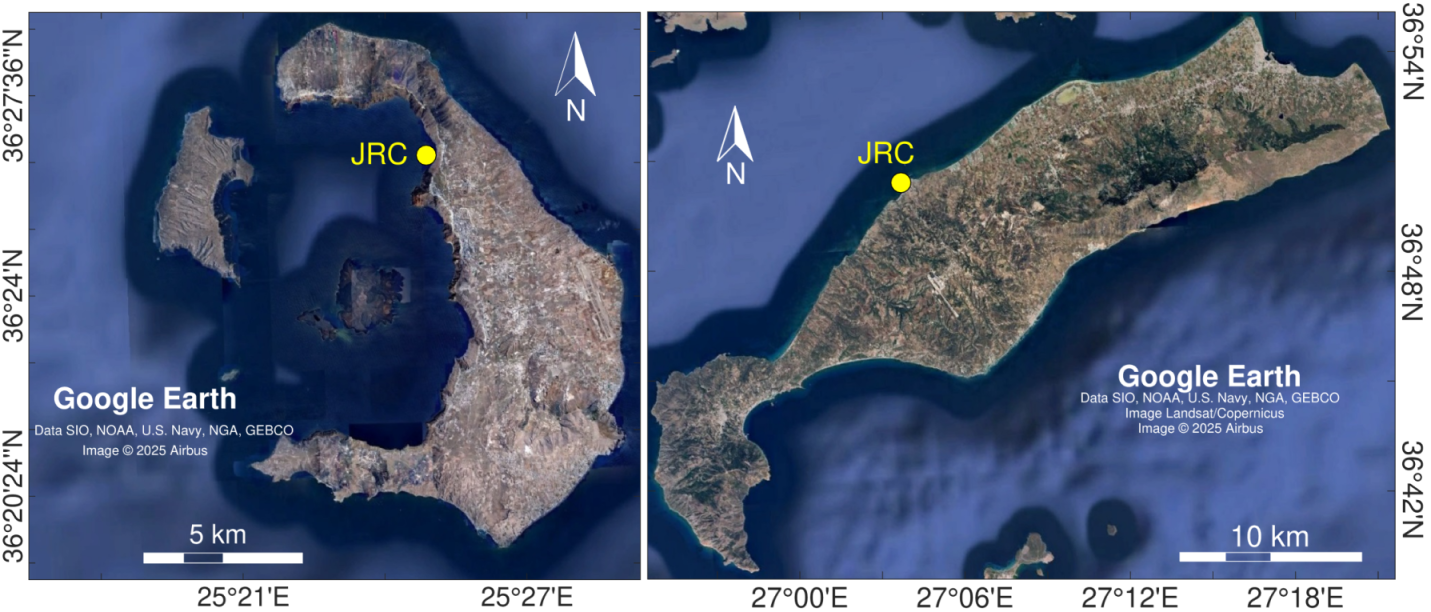
Mean and extreme sea level (due to storm) data were collected from the global database of the Joint Research Center (JRC) of the European Commission. Through geospatial analysis in a GIS environment, the nearest data points to the two islands were identified. Trends for the baseline period (1980–2014) and future projections of Extreme Sea Level (ESL) and its components were analyzed for storm events with return periods of 1, 5, 10, 20, 50, 100, 200, 500, and 1,000 years. ESL was calculated as the sum of mean sea level (or long-term relative sea level rise, RSLR, in future scenarios), astronomical tide, and episodic storm-induced sea level elevation (ηCE). The latter is driven by the combined effects of storm surge and wave setup. Projections of ESL under extreme storm conditions were analyzed for the years 2030, 2050, and 2100, considering two emissions scenarios: a moderate pathway (RCP4.5) and a high-emissions scenario (RCP8.5).
Meteorological parameters - Trends and Projections
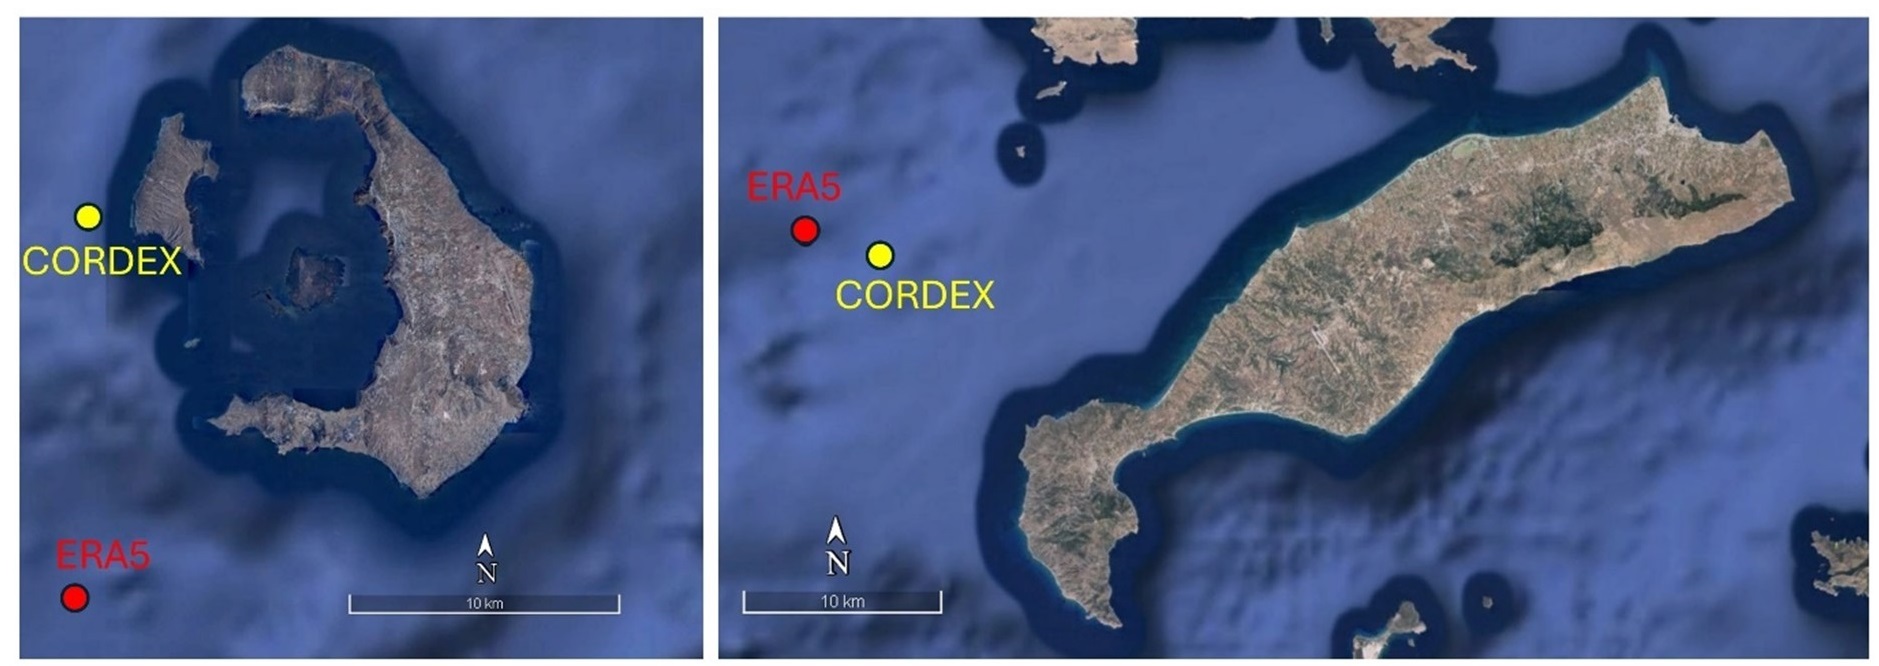
Monthly means of meteorological (temperature, humidity, rainfall, cloud coverage, wind speed) and wave parameters (significant wave height, mean period, wave direction)were extracted for the last available 20-year period (2003 – 2023). The aforementioned parameters are available through the Copernicus service of the European Union. The ERA-5 re-analysis product was extracted, which is widely used for reconstruction of the world’s climate for the last 80 years downscaled for the islands of study (ERA-5 e-database). In order to investigate the future climatic parameters, the reference years of 2050 and 2100 were used under 2 climate emission scenarios (RCP 4.5 και RCP 8.5). Climate parameters were extracted from the CORDEX e-database (Coordinated Regional Climate Downscaling Experiment), which is the outcome of a variety of modeling ensembles across the globe (CORDEX e-database).
The spatial resolution of the Copernicus ERA-5 e-databaseτ is of 0.5° x 0.5°, while the resolution of the CORDEX products are of 0.11° x 0.11°, for this reason, the closest and most representative points for each island were extractes, as shown below.
