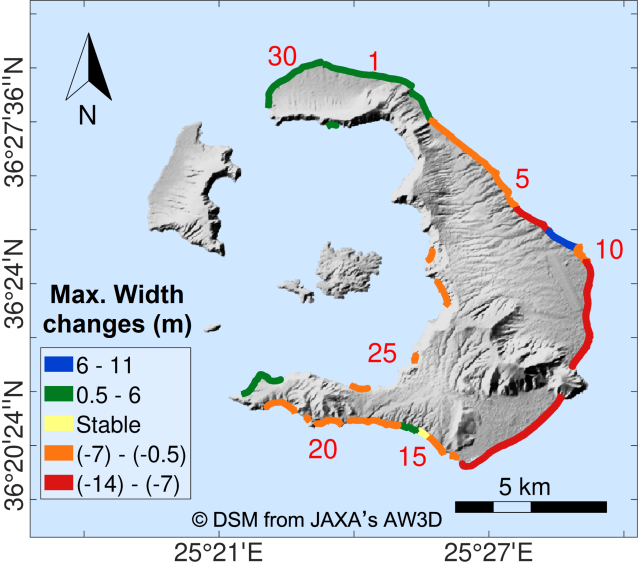
Historical changes/trends of beach erosion
To assess the historical trends of coastal erosion/accretion of all the beaches of the 2 islands, satellite images from the historical imagery tool in Google Earth Pro were used. Specifically, comparisons were made for different time periods using two distinct indicators: the area and the maximum "dry" width of the beaches. Also historical shoreline changes were studied for the pilot beaches (Kamari-Santorini, Marmari-Kos) through a shoreline detection algorithm using widely available open source satellite images (e.g., Sentinel, Landsat). The accuracy of the satellite image detections was evaluated using data from the optical monitoring system.

Methodological framework for assessing beach erosion risk
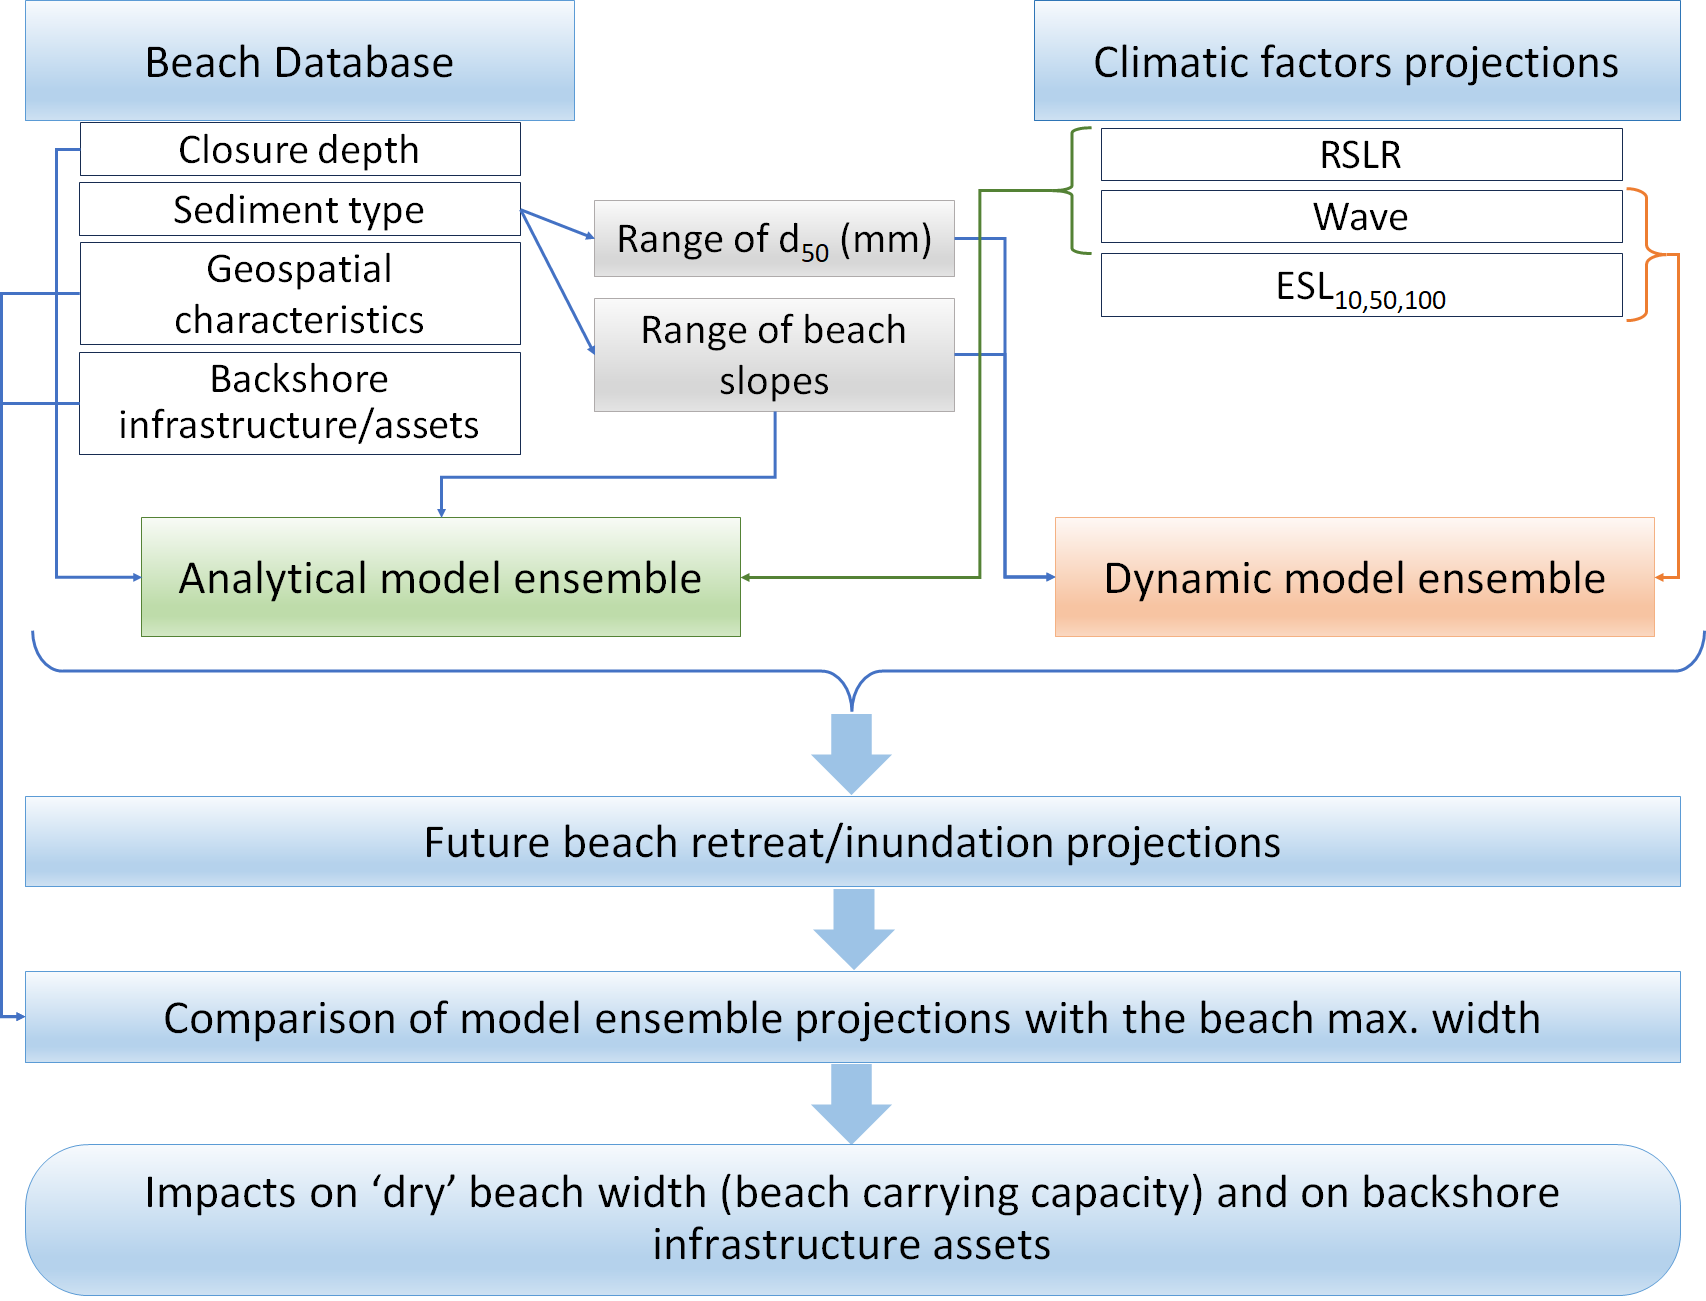
The beach spatial characteristics and other attributes recorded in the database were used in conjunction with the projections of the extreme sea levels (ESLs) and corresponding waves to set-up morphodynamic models and obtain estimates of beach erosion/retreat at the 2 islands under mean and extreme (storm induced) sea level rise. More specifically, beach erosion/retreat was estimated at an island scale using appropriate ensembles of cross-shore (1-D) morphodynamic models. Ensemble methods have been found to perform generally better than individual models. As the sensitivity to different forcing factors varies among individual morphodynamic models, ensemble techniques exploit each model’s strength and mitigate its weaknesses. Following this concept, two model ensembles were created: (a) an analytical ensemble consisting of the models Bruun, Dean and Edelman, which was used to assess beach retreat due to long-term mean sea level rise (RSLR) and (b) a numerical (dynamic) model ensemble comprising the models SBEACH, Leont’yev, Xbeach and Boussinesq which was used to assess beach retreat under episodic extreme sea level (ESL). Regarding topographic and bathymetric data, since the models were applied at an island scale, the use of in-situ measurements was not feasible. Therefore, linear profiles were used as initial bathymetry, taking into account a plausible range of slopes and median sediment sizes, based on qualitative information gathered from optical information available on Google Earth Pro and other online sources. The minimum, maximum, and median values of the model ensemble predictions were calculated and compared with the recorded maximum beach widths to estimate: (i) the percentage of the "dry" beach reduction/inundation, and consequently, the impact on the beach carrying capacity, and (ii) the effects on the backshore infrastructure/assets. The procedure is summarized in the flow chart below.

Flowchart of the methodological framework for assessing beach erosion risk.
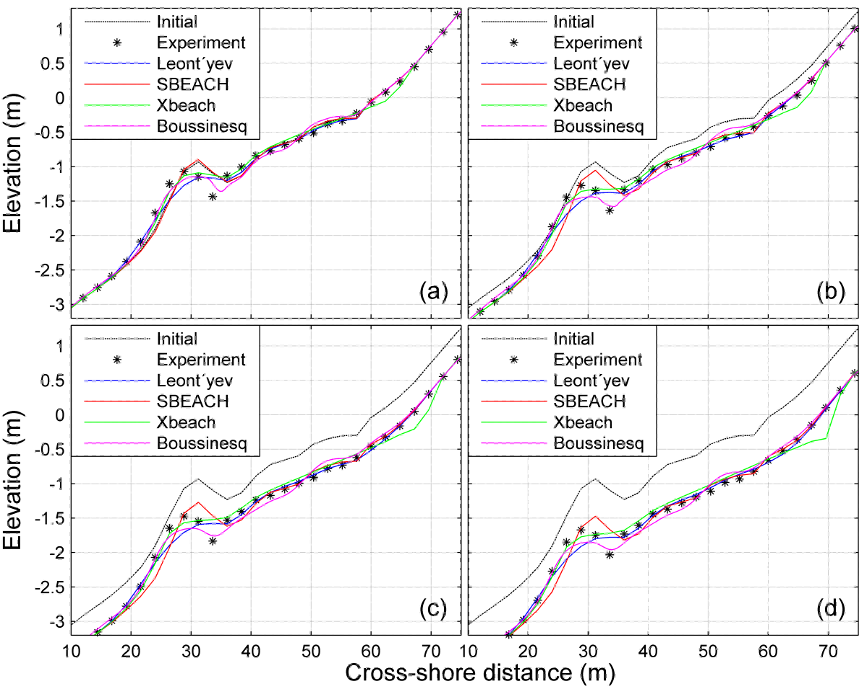
The models were validated against physical experiments conducted at the GWK wave flume (Hanover, Germany) in 2013. For further details, see Monioudi et al. (2017).

Profiles by numerical models plotted against results from physical experiments at the large wave flume (GWK, Hanover): (a) initial/present water level; (b) water level rise of 0.2 m; (c) water level rise of 0.4 m; and (d) water level rise of 0.6 m. Both numerical and physical experiments were set up for the same initial (nonlinear) profile (Monioudi et al., 2017).
Α beach classification system/tool that can describe the grade of vulnerability of the beaches under Climate Variability & Change (CV & C) at an island scale was developed based on a limited number of physical and socio-economic variables/indicators. Indicator selection is assisted by a Strength-Weaknesses- Opportunities-Threats (SWOT) framework, while multi-criteria analysis (e.g. AHP, TOPSIS, PROMETHEE) is used to rank beach vulnerability in order to prioritize adaptation responses/measures to beach erosion. Relevant, representative, and measurable indicators are selected to describe the criticality of the beaches (environmental and socio-economic value) and their vulnerability to erosion/flooding risk (e.g. erosion trends and projections, touristic activity, protected areas).
